ECU’s 2024 Greenhouse Gas Inventory
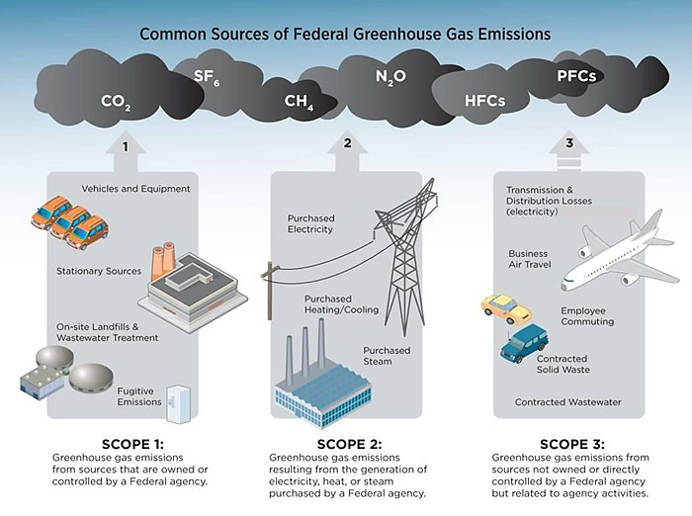
Understanding current greenhouse gas (GHG) emissions is a necessary step towards developing goals for lowering future GHG emissions and strategies to combat global climate change. There have been numerous changes in campus infrastructure over the years, with a potential to change source distribution and total amount of GHG emissions. GHG inventories are comprised of three distinct scopes of emissions sources. Scope 1 includes GHG emissions from sources that are owned or controlled by the University such as on-campus stationary sources (natural gas, propane, and distillate oil), vehicles and equipment (direct transportation), fugitive emissions (refrigerants and chemicals), and fertilizer used by athletics and grounds services. Scope 2 includes purchased electricity. Scope 3 is the most difficult to track including emissions not owned or directly controlled by the University, but related to ECU activities such as commuting, directly financed air travel and mileage reimbursed, solid waste, wastewater, paper purchasing, Fuel- and Energy-Related Activities (FERA), and Transmission & Distribution (T&D) losses.
SIMAP® is a carbon and nitrogen-accounting platform that ECU uses to track, analyze, and improve our campus-wide sustainability. The proven algorithms, based on nearly two decades of work supporting campus inventories with the Campus Carbon Calculator, CarbonMAP and Nitrogen Footprint Tool, help us to:
- Create a baseline
- Benchmark our performance
- Create reports
- Set goals
- Analyze our progress year over year
The carbon footprint includes greenhouse gas emissions in the form of CO2, CH4, N2O, and refrigerants/chemicals. The calculation of the carbon footprint follows the guidelines from the GHG Protocol. Whenever possible, the same data sources are used for both the carbon and nitrogen footprint for alignment in methods and system bounds. The main source for the carbon footprint emission factors is the EPA US GHG Inventory.
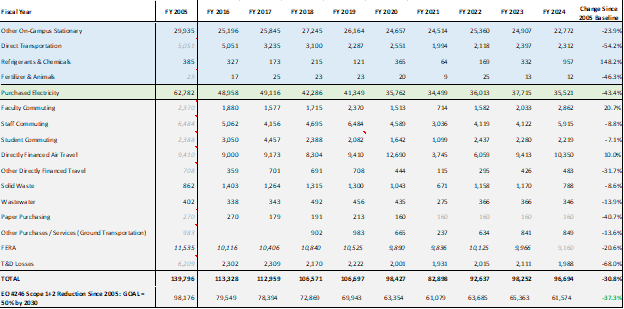
The largest contributor to the GHG emissions profile of ECU has remained to be Scope 2 – Purchased Electricity, which accounts for about 37% of ECU’s total carbon footprint. Scope 1 emissions sources consistently account for another 37% of GHG emissions, while Scope 3 emissions sources contribute a little over a quarter of the total. In 2018, NC Governor Cooper issued Executive Order No. 80, which mandated that state agencies reduce Scopes 1 and 2 GHG emissions 40% by 2025 and, in 2022, Executive Order No. 246 increased that goal to 50% GHG emissions reductions by 2030. In comparison to the 2005 baseline of GHG emissions, ECU has reduced its carbon footprint approximately 37% on scopes 1 and 2 emissions. Below you can review the 2024 GHG emissions Scopes, Categories, and a comparison of full results from compiling GHG emissions inventories since FY 2016.
FY 2005 Baseline Inventory – GHG Emission Source Categories:
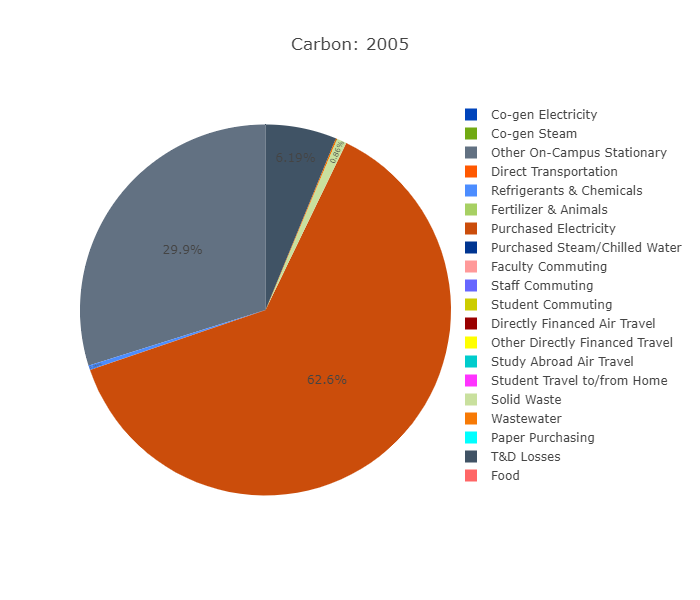
FY05 Categories
FY 2005 Baseline Inventory – GHG Emission Source Scopes:
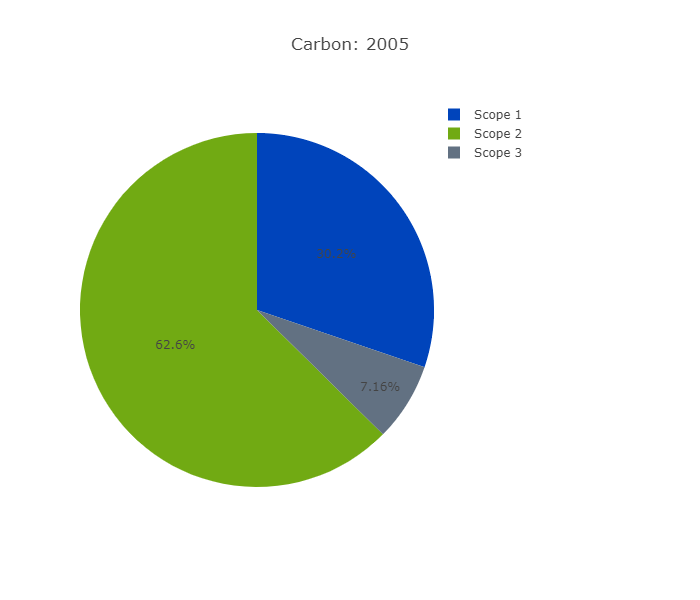
FY05 Scopes (Baseline)
FY 2024 Inventory – GHG Emission Source Categories:
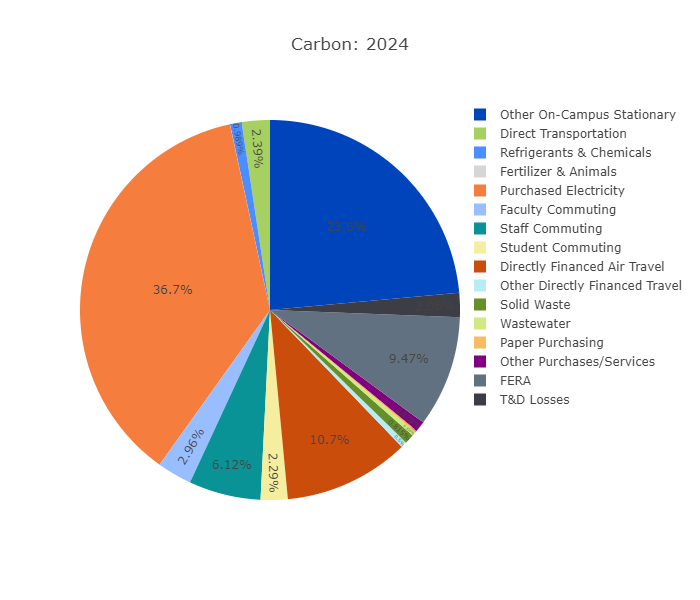
FY24 Categories
FY 2024 Inventory – GHG Emission Source Scopes:
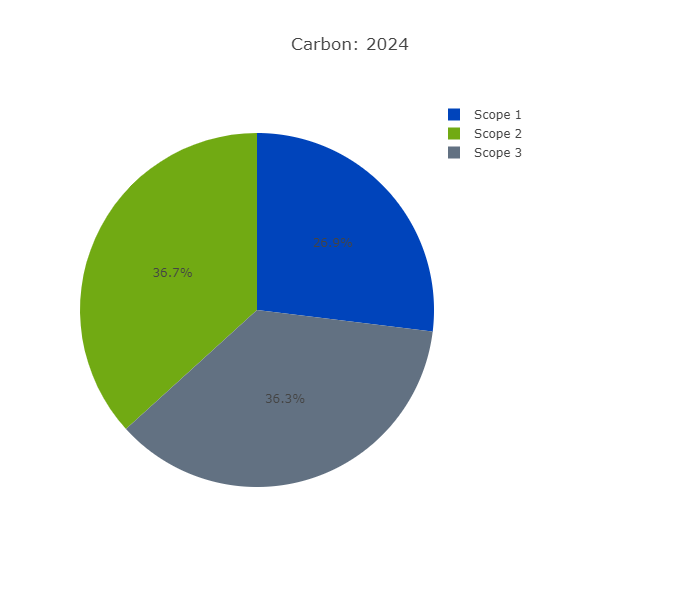
FY24 Scopes
FY 2016 – FY 2024 Comparison Chart:
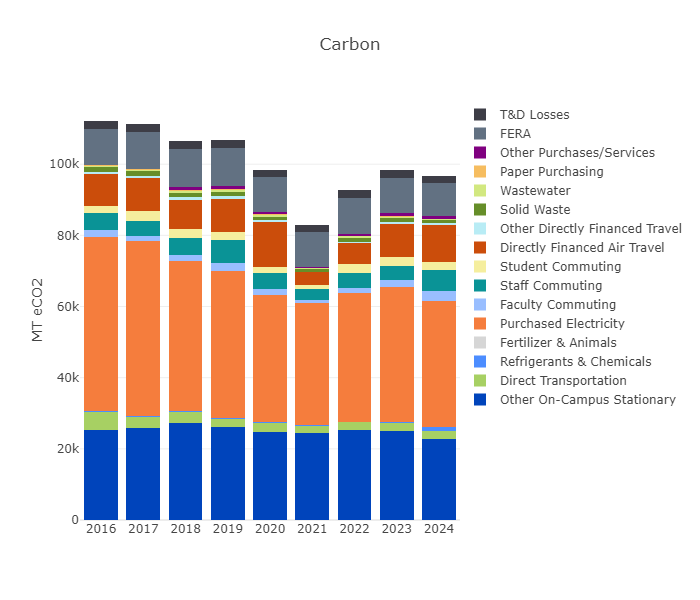
FY 2005 – FY 2024 Comparison Table:
